Estimating High-Resolution Weather Metrics from Climate Model Data
Definitions
- Variable: A simple weather observation such as daily maximum temperature or daily total precipitation.
- Metric: A derived measure based on variables, such as "the average number of days per year where the maximum temperature exceeds 35°C" or "the average number of days per year with more than 10mm of rainfall." More complex metrics include the annual average number of consecutive wet days (>1mm), heatwaves intensity/frequency (using BoM definition), and Standard Precipitation Index (SPI) statistics.
Introduction
The goal of this research is to develop a method for producing continuous graphs of weather metrics over time, from 1950 to 2100, at a given point in Australia. This involves integrating two datasets of gridded weather data: the Bureau of Meteorology (BoM) Australian Gridded Climate Dataset (AGCD) and the CMIP6 climate model data. The AGCD has a spatial resolution of 0.05 degrees and is derived from interpolating weather observations from 1950 to present. The CMIP6 dataset, on the other hand, simulates the climate under various emissions scenarios from 2015 to 2100 and has a spatial resolution of approximately 0.25 degrees. This spatial relationship is illustrated below.
![]()
The nature of CMIP6 climate models means that while there is data for 2015 onward, this data does not match the observed day-to-day weather. It is only attempting to represent the general climate. That is to say the CMIP6 climate models allow us to peer into the future, albeit with extremely blurry vision. This picture of the future is blurred not just spatially, but also temporally. To explain by way of example: while a CMIP6 temperature at a given point on a given day in 2015 should not be expected to match what was observed, the average temperature for a region over the 2015 to 2024 period should match what was observed.
We are not attempting to plot average temperature, but rather extreme weather metrics that can be derived from temperature (and precipitation). These metrics could be as simple as the average number of days over 35°C per year, or as complex and the average length of moderate-severity heatwaves as per the BoM definition (a somewhat complex calculation based on the Excess Heat Factor). We have found that regardless of how well a weather variable like temperature lines up between AGCD and CMIP6, these derived metrics usually have significantly different values for the same period, even if averaging over many years (2015-2024). So essentially our goal is to "downscale" data from the large CMIP6 pixels to match the spatial detail of the smaller AGCD pixels in terms of both average absolute value and statistical behaviour.
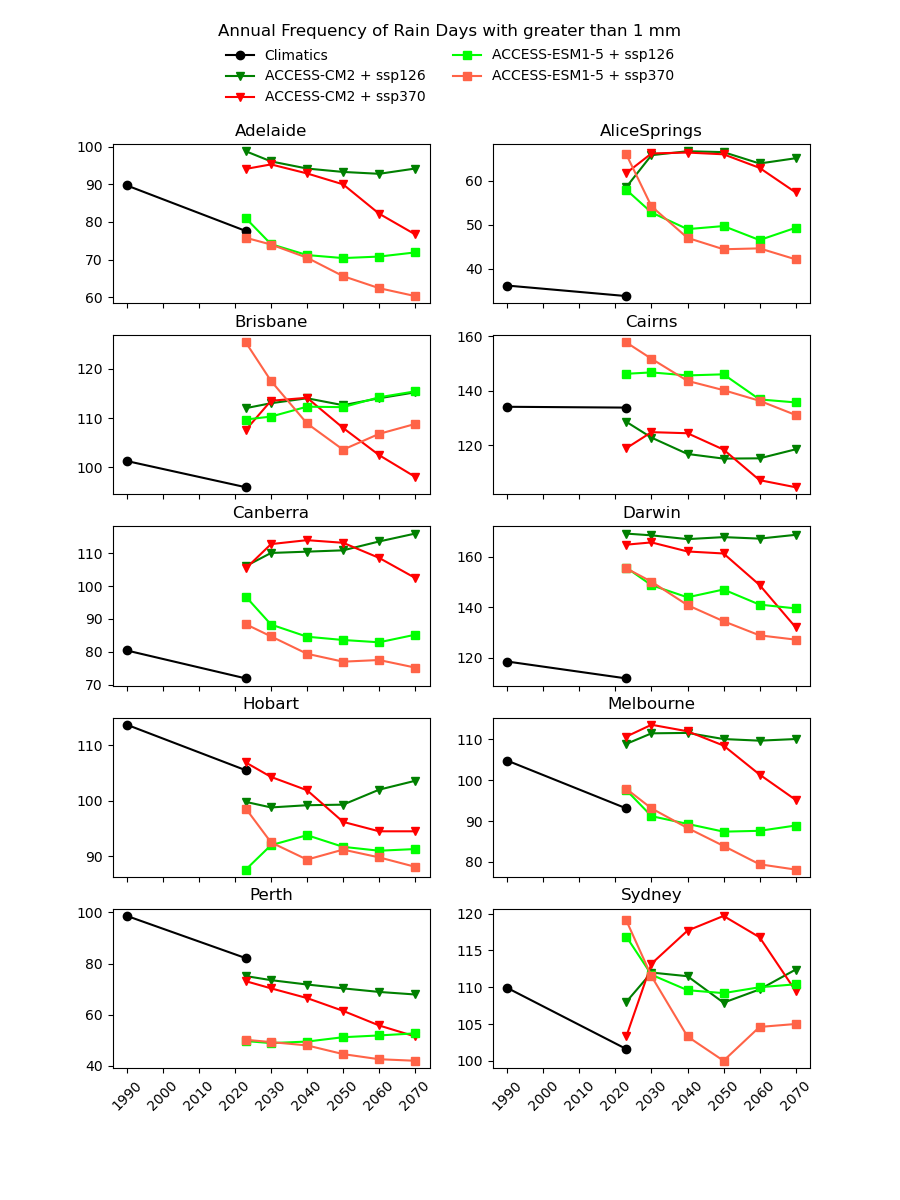
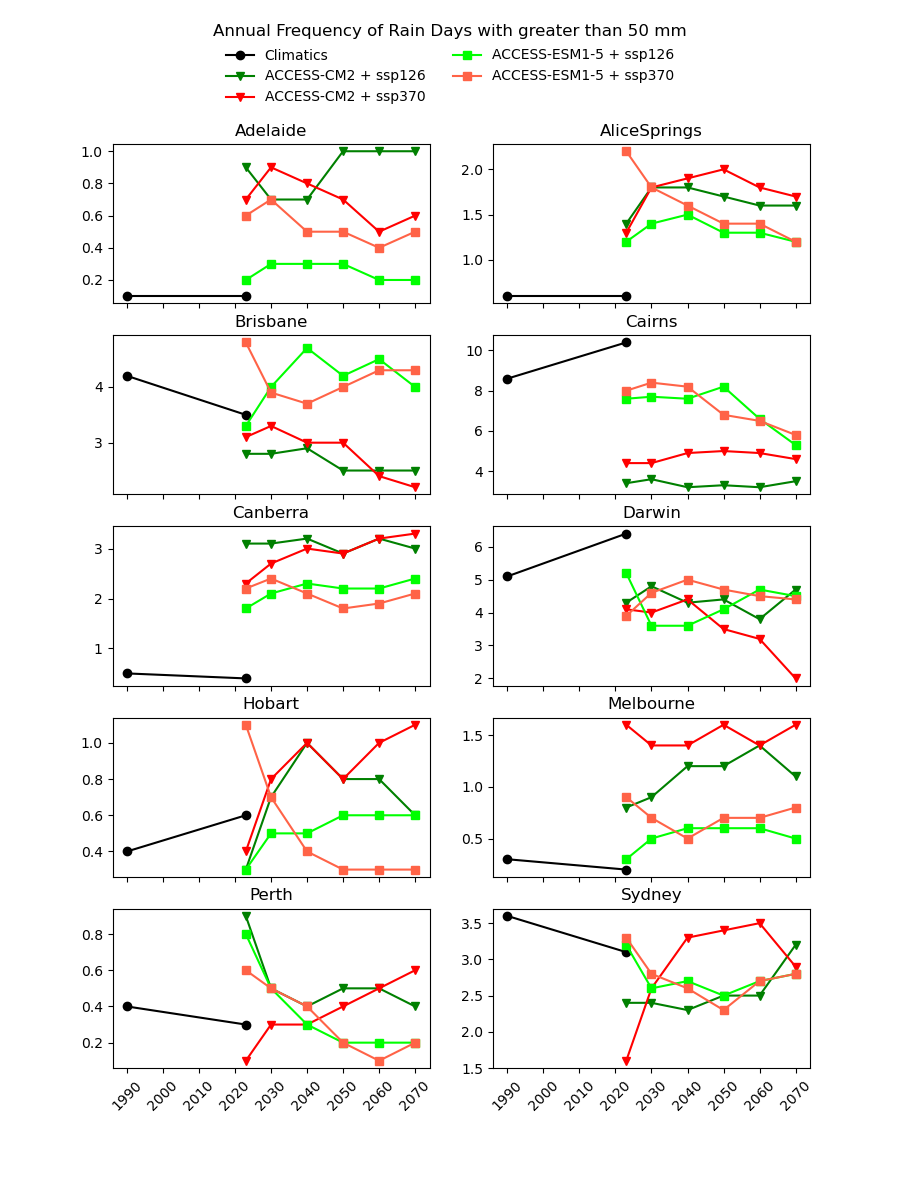
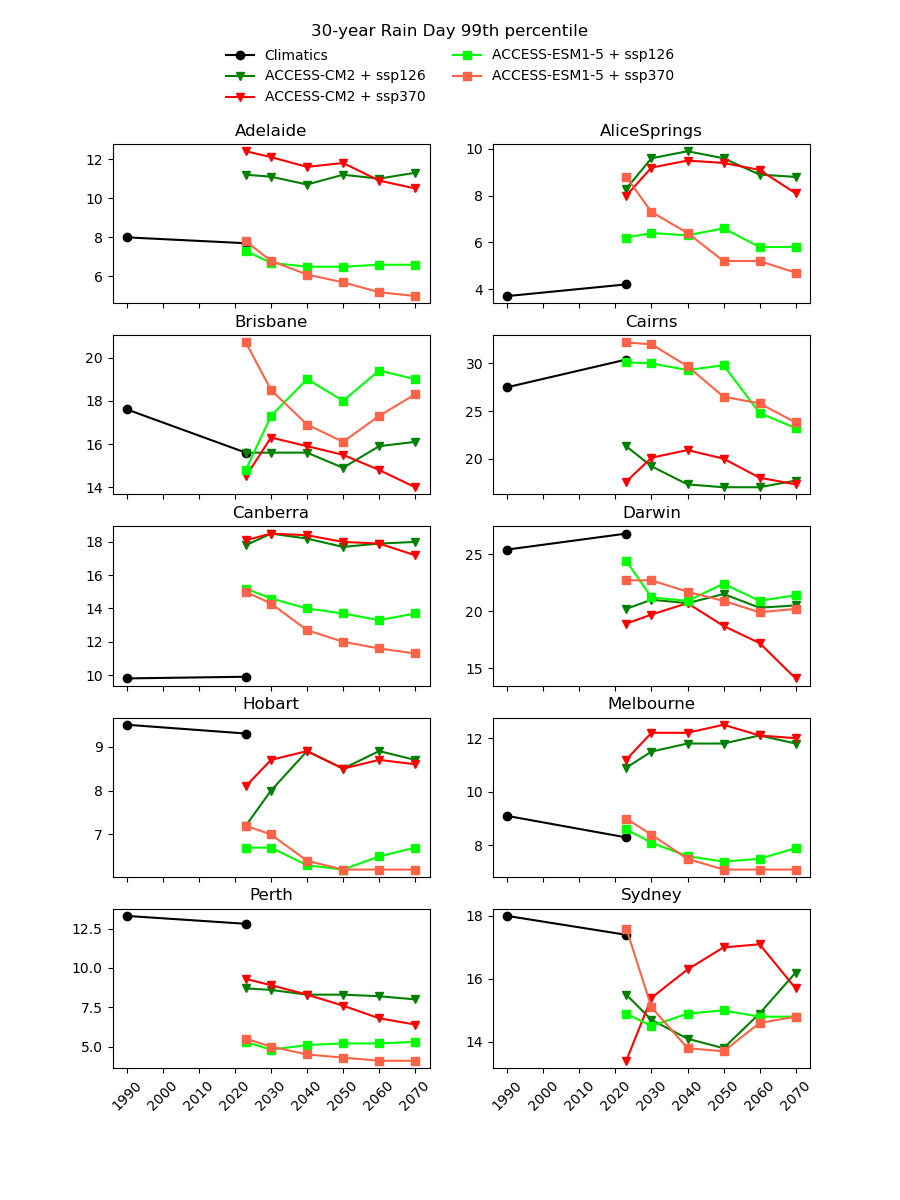
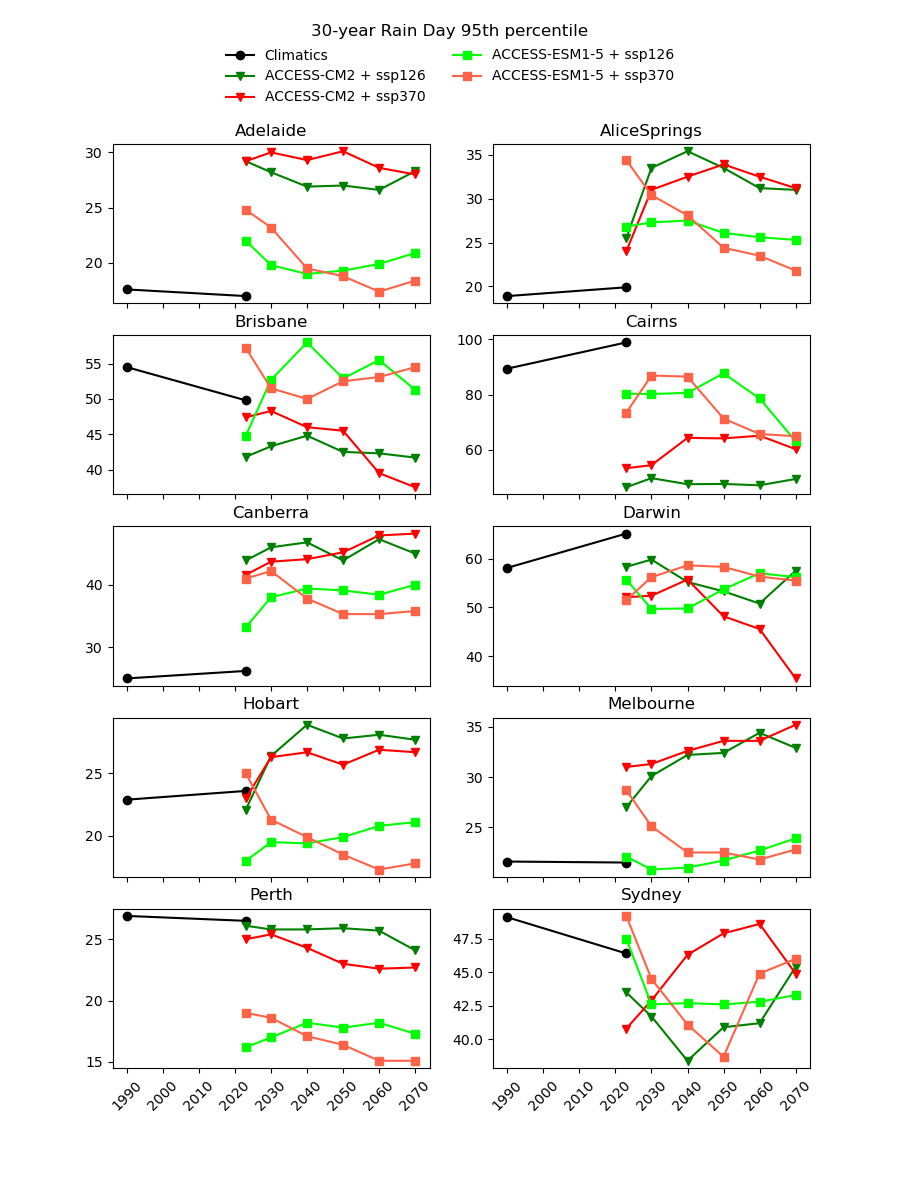
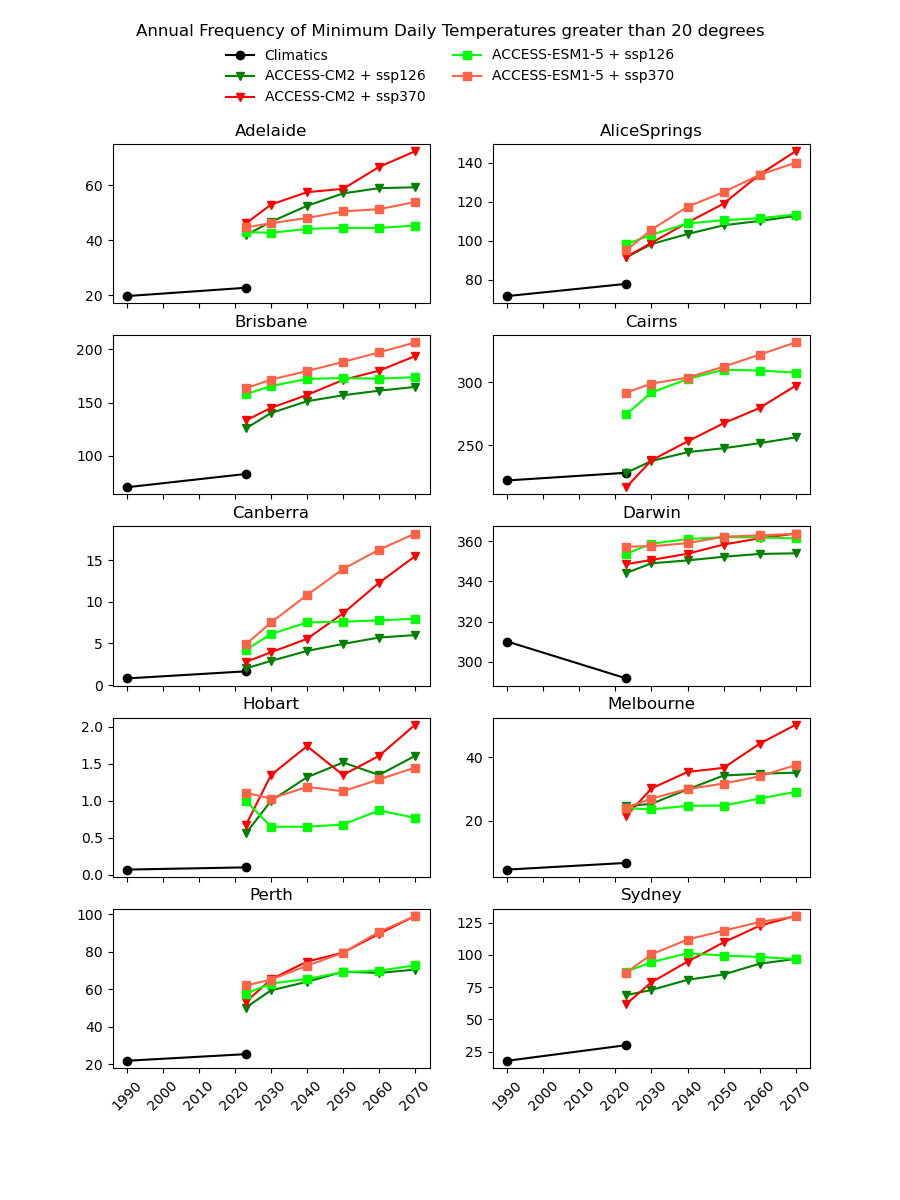
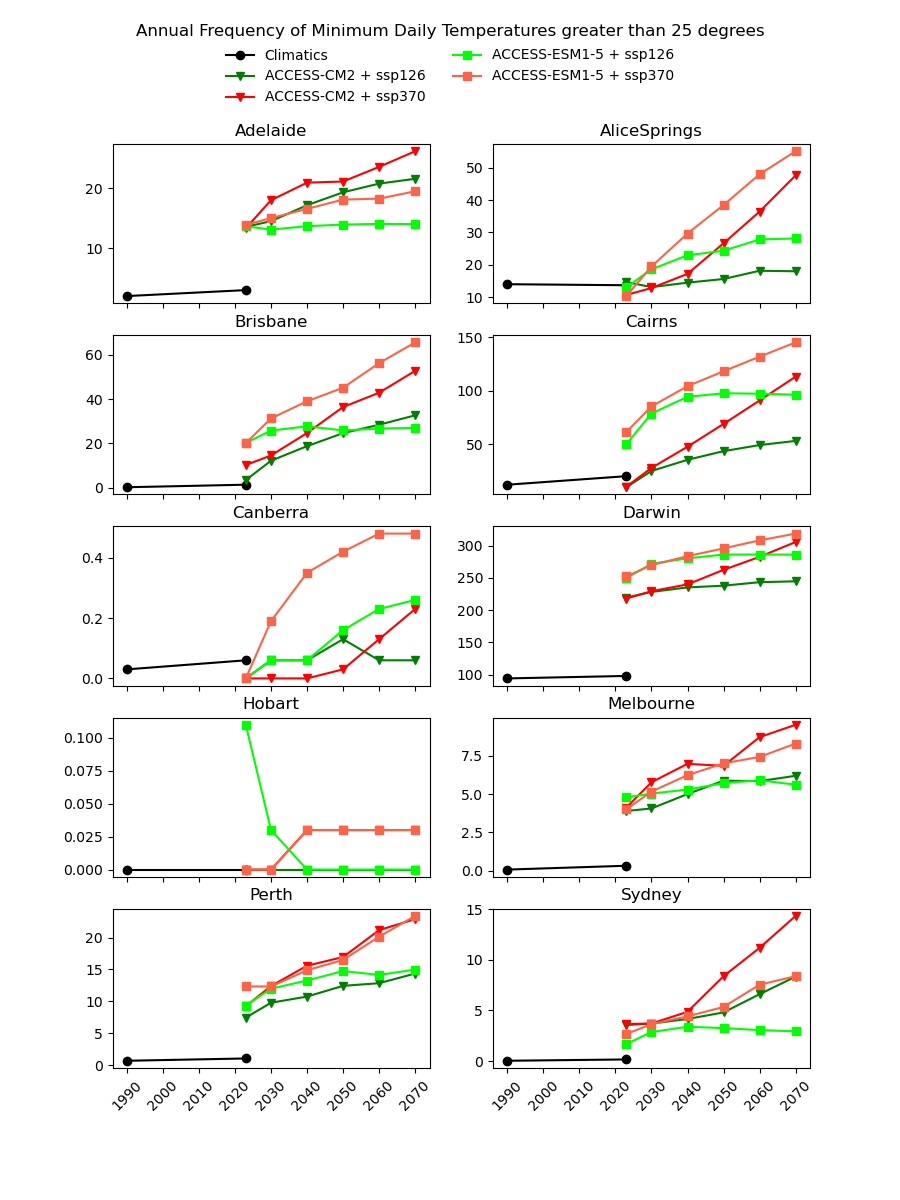
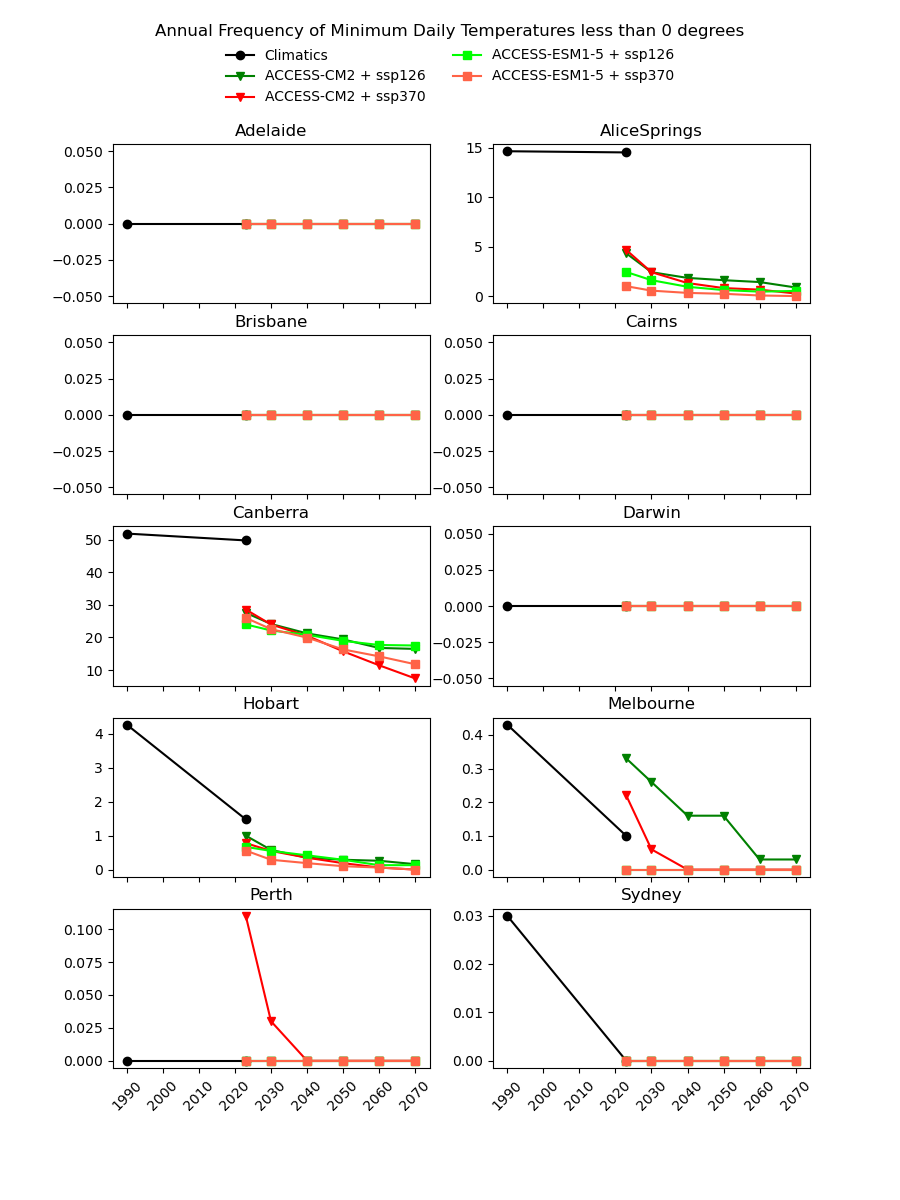
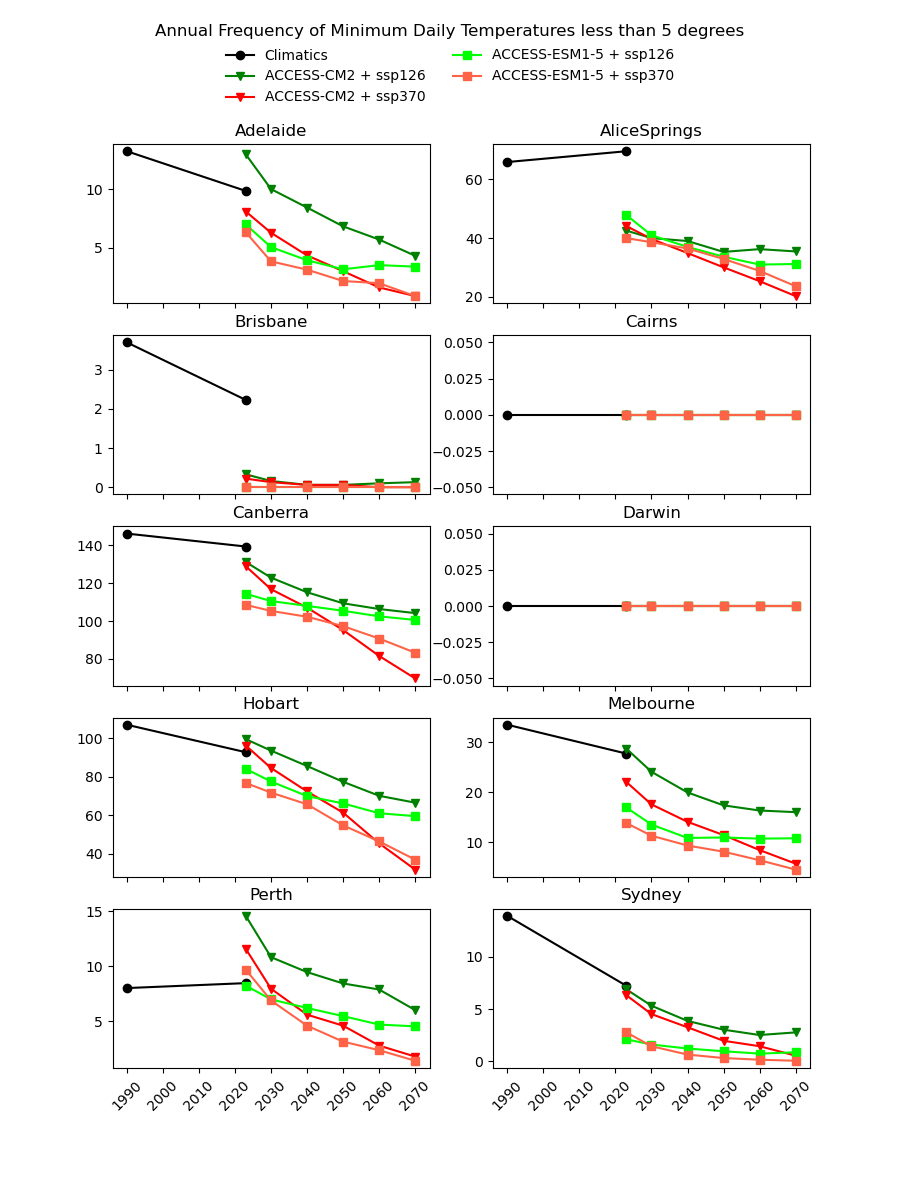
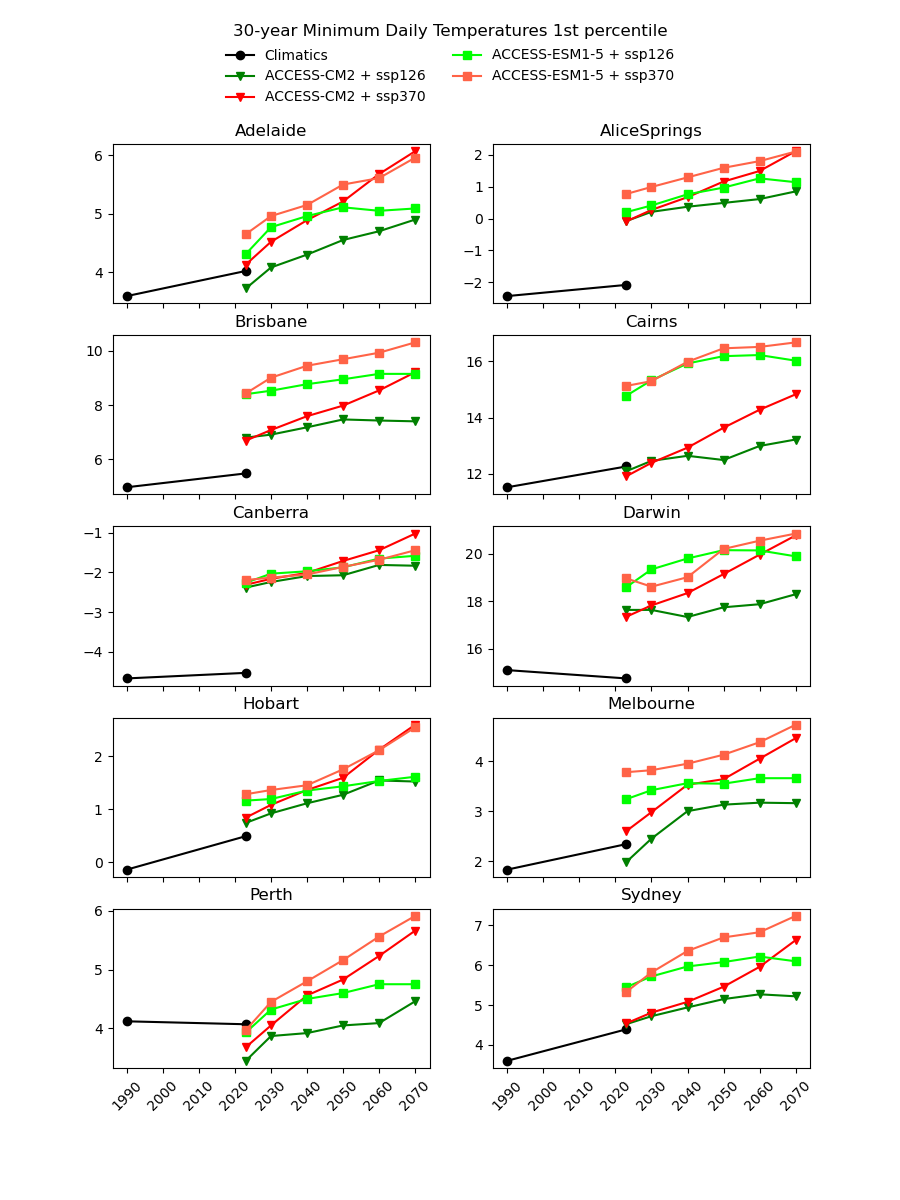
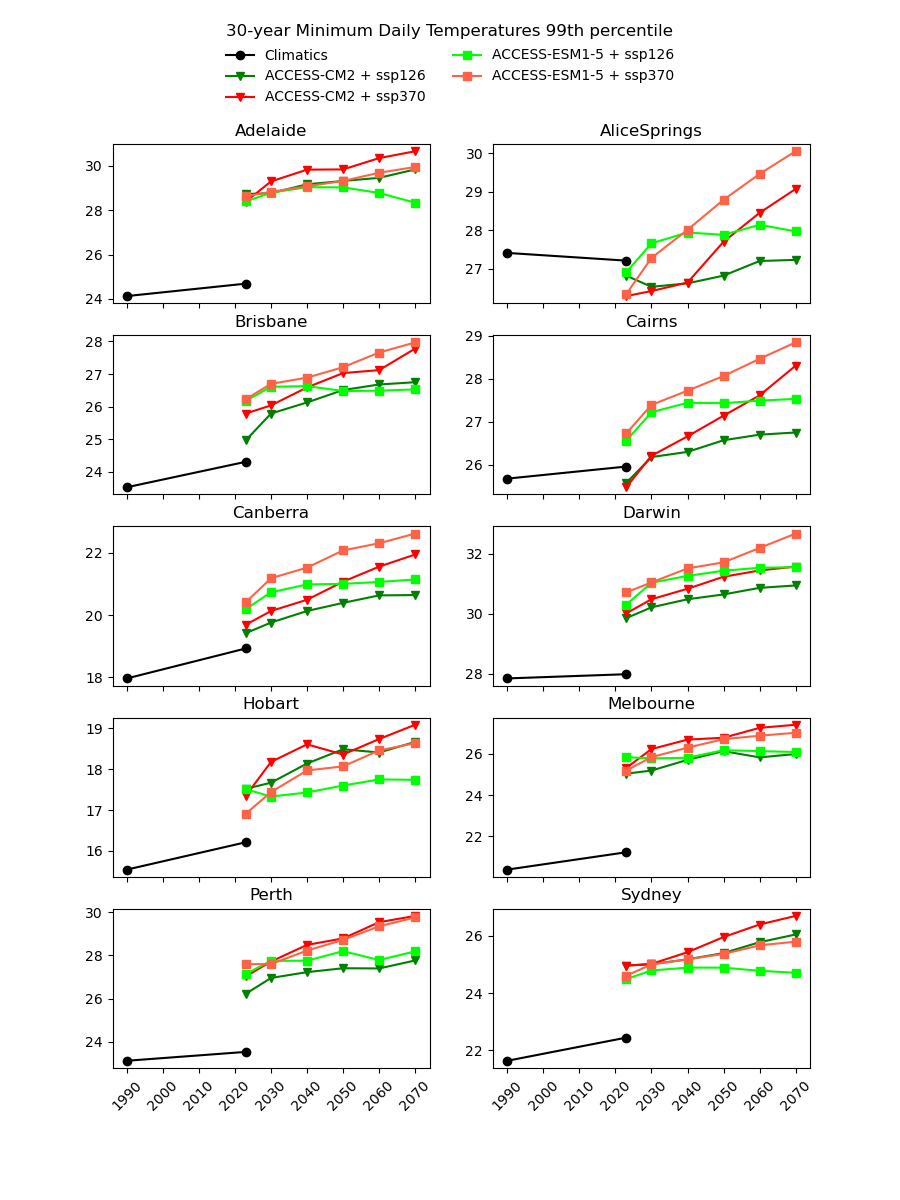
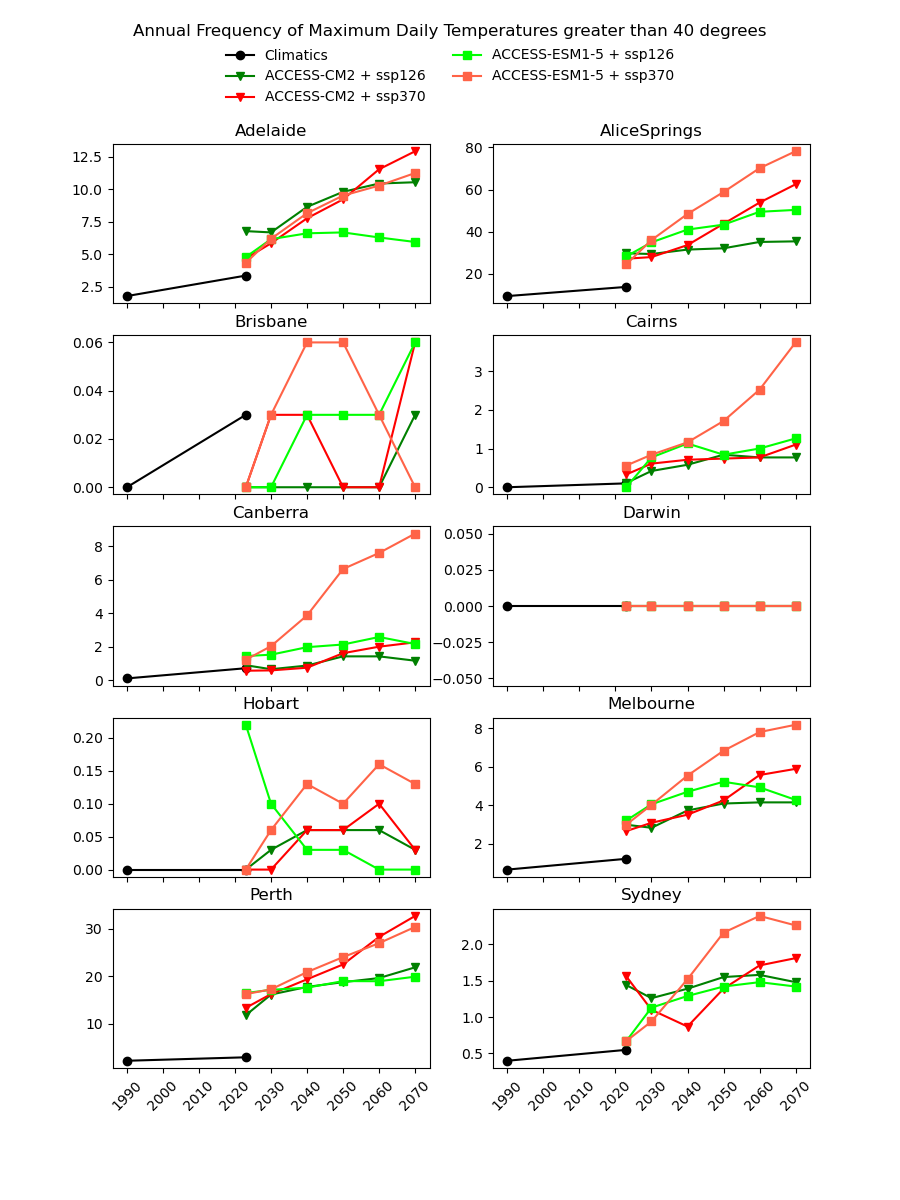
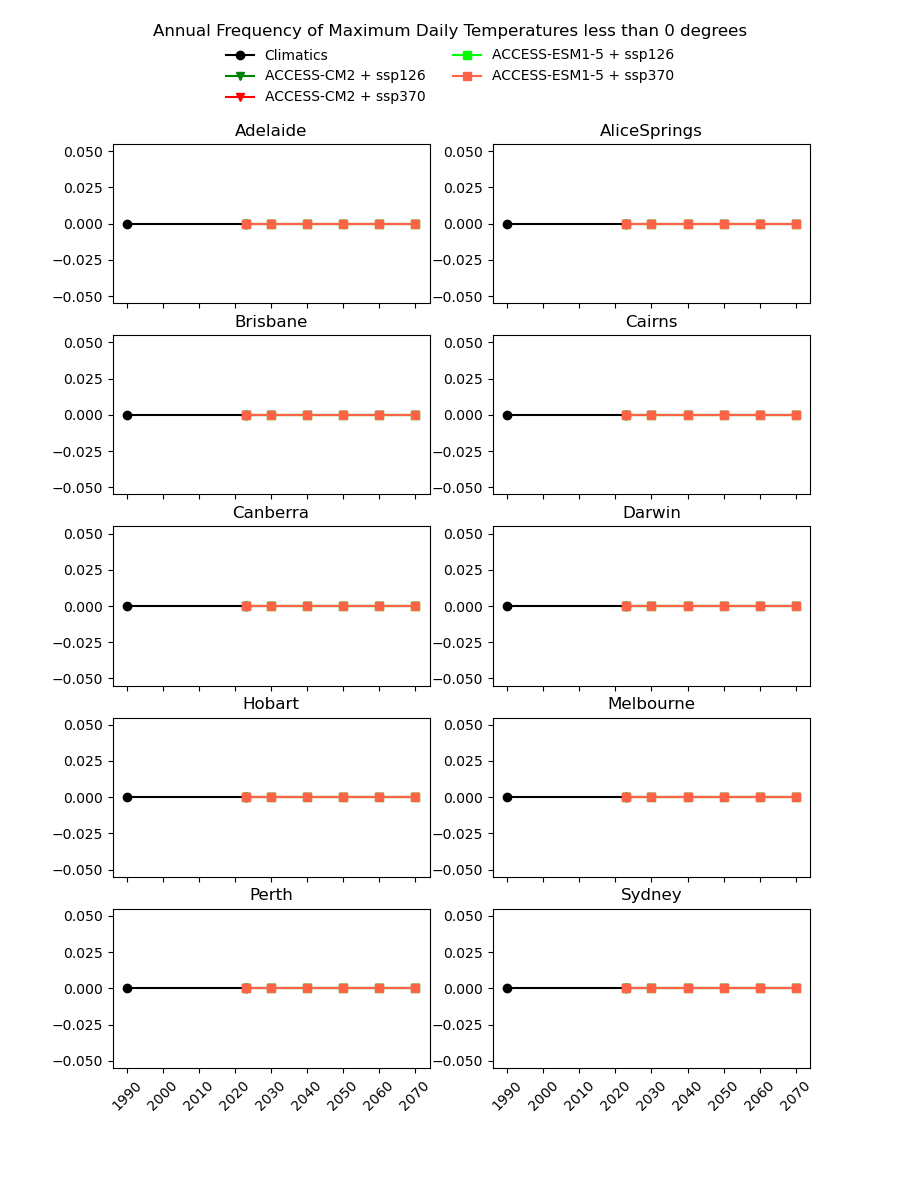
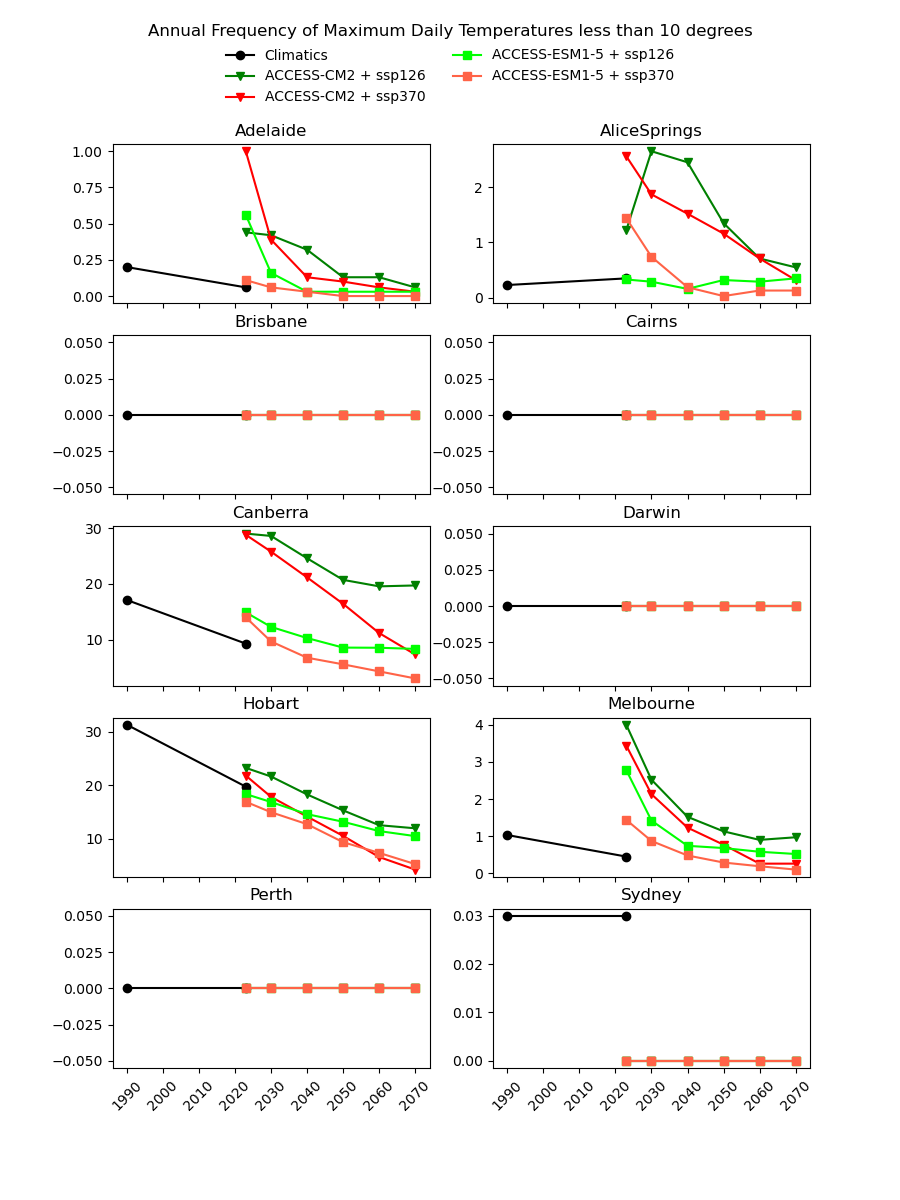
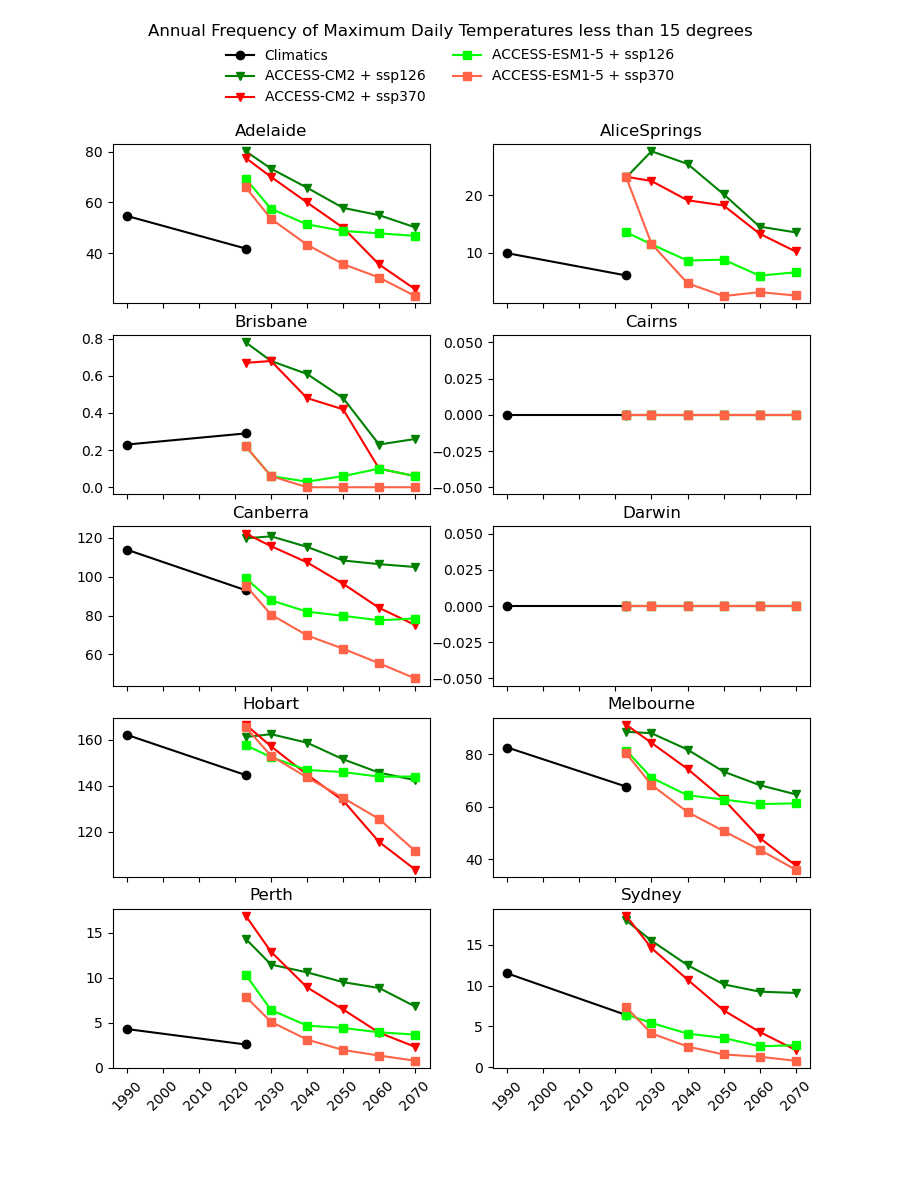
There are existing efforts to downscale CMIP6 data using physics-based approaches, which are complex and computationally intensive. In theory, they should produce a version of the CMIP6 data that is almost the same spatial resolution as the AGCD data. One might therefore expect this downscaled data to have a reasonably good agreement with current observations. However, in our testing, we have not found this to be the case, as illustrated in the image below for a number of Australian cities.
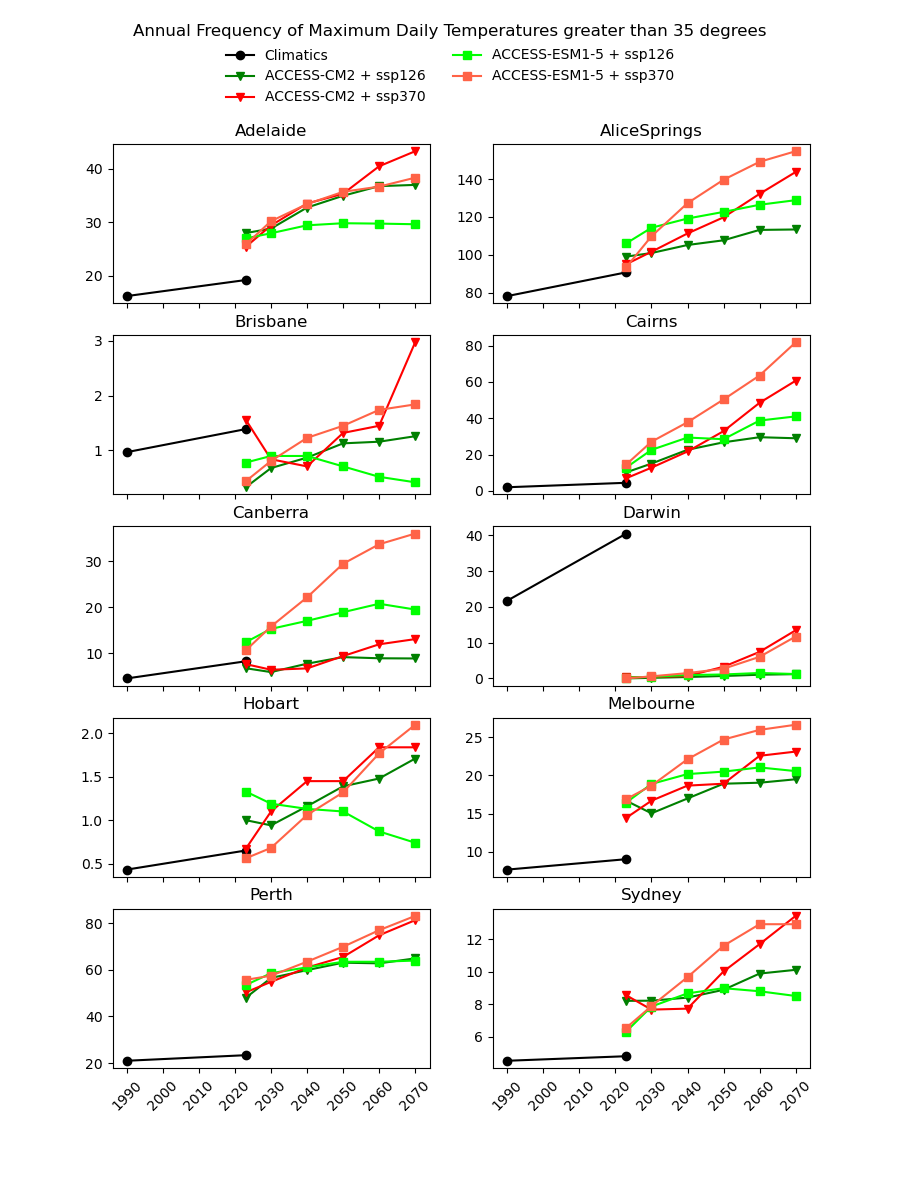
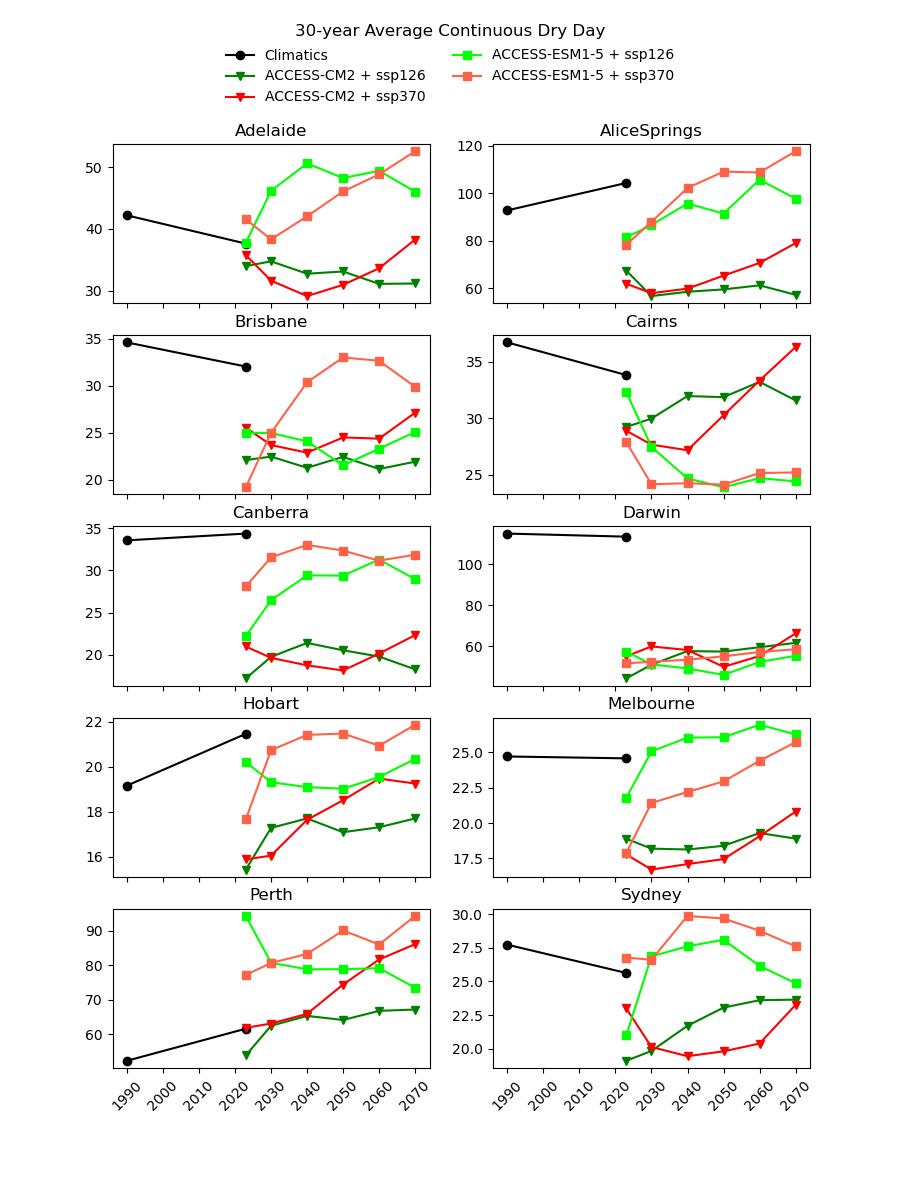
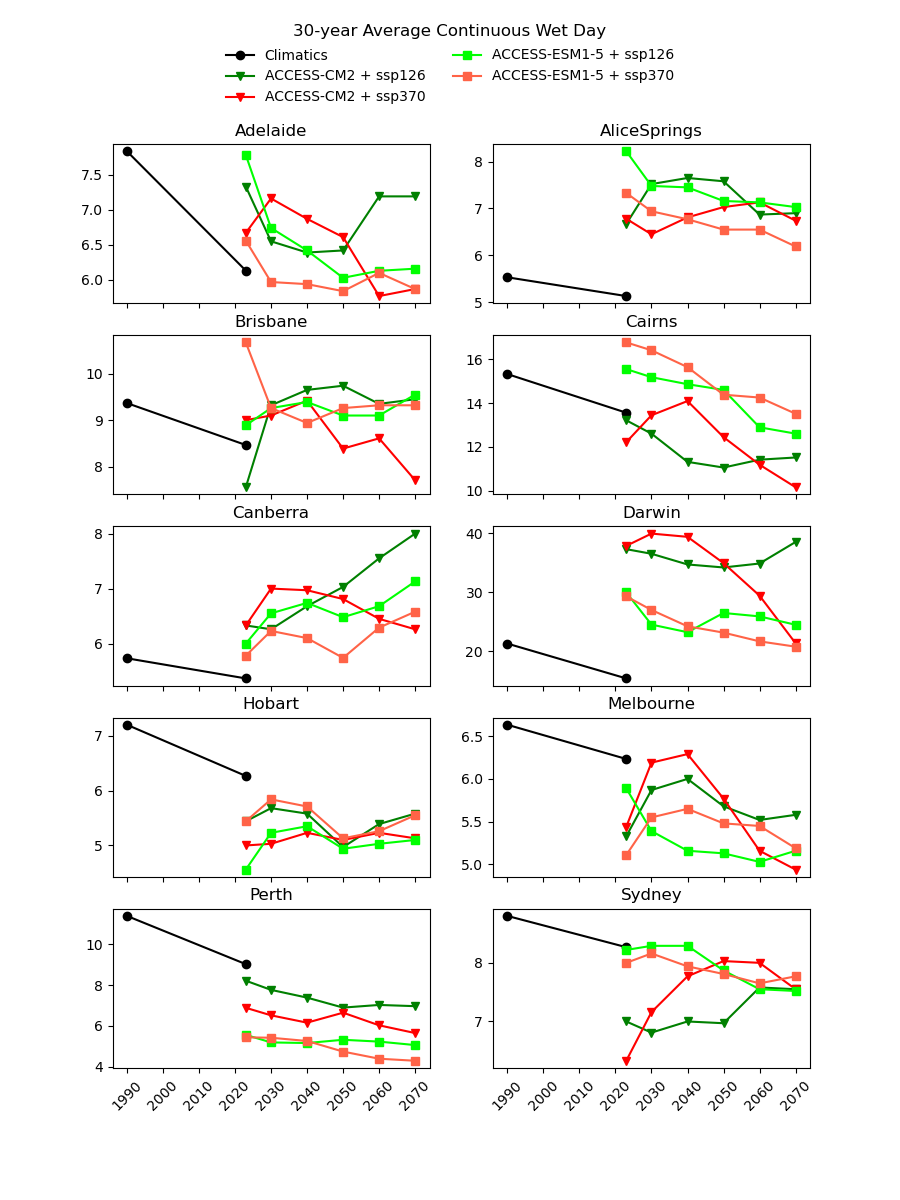
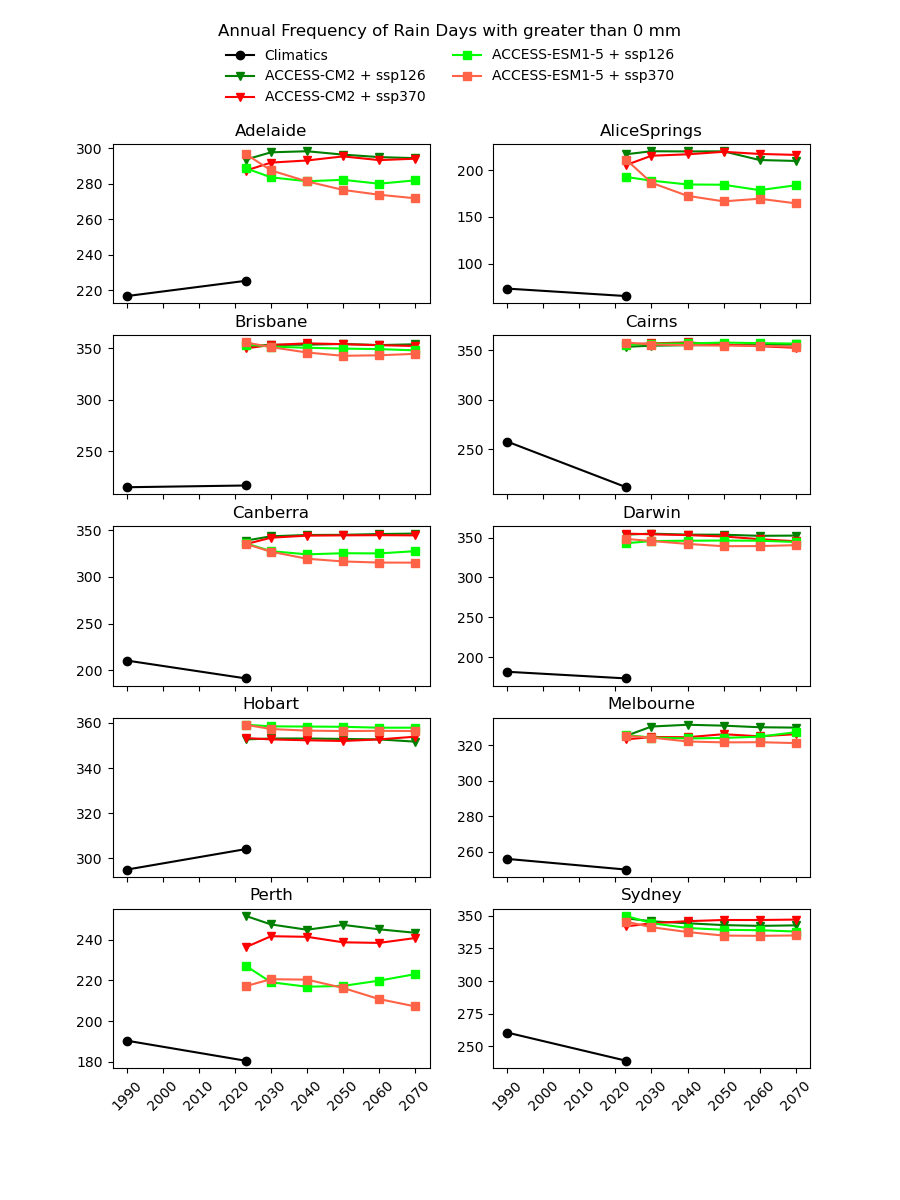
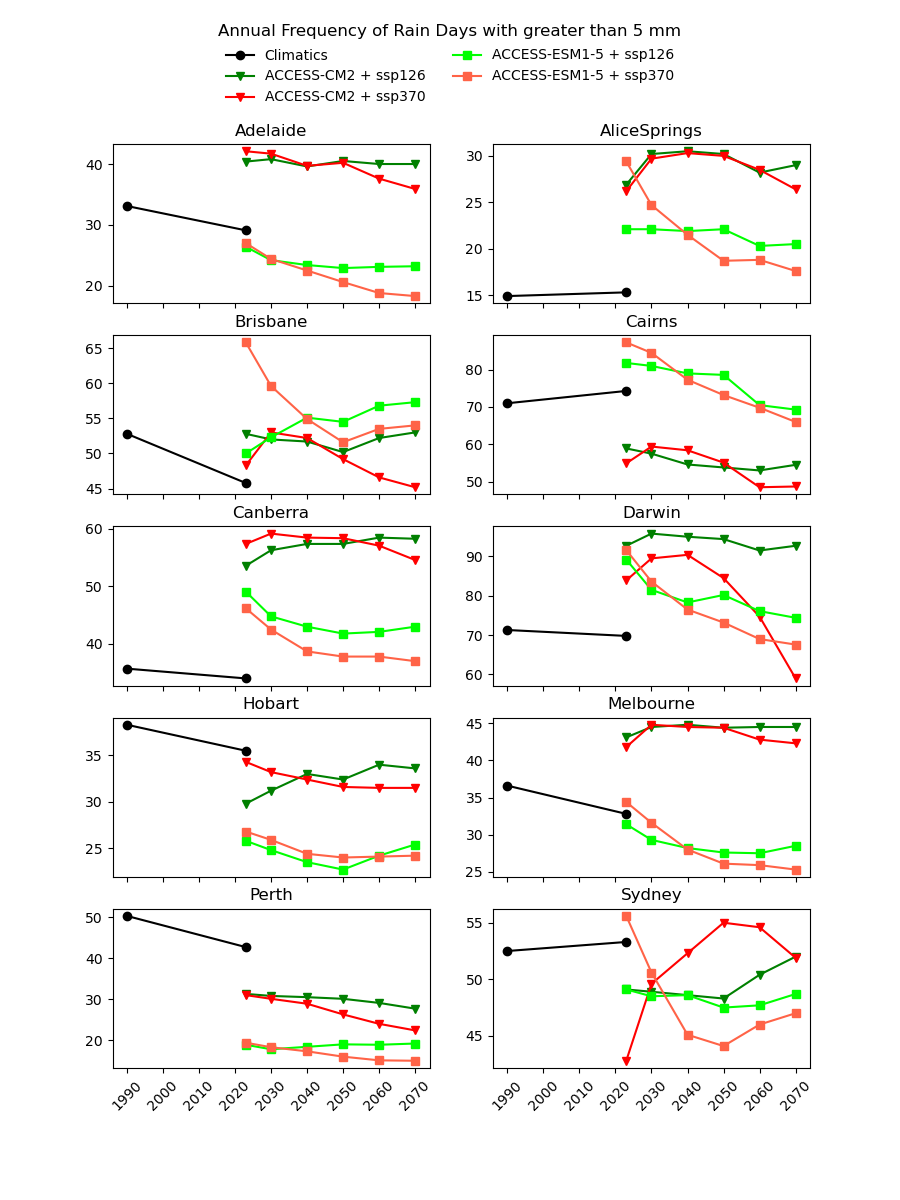
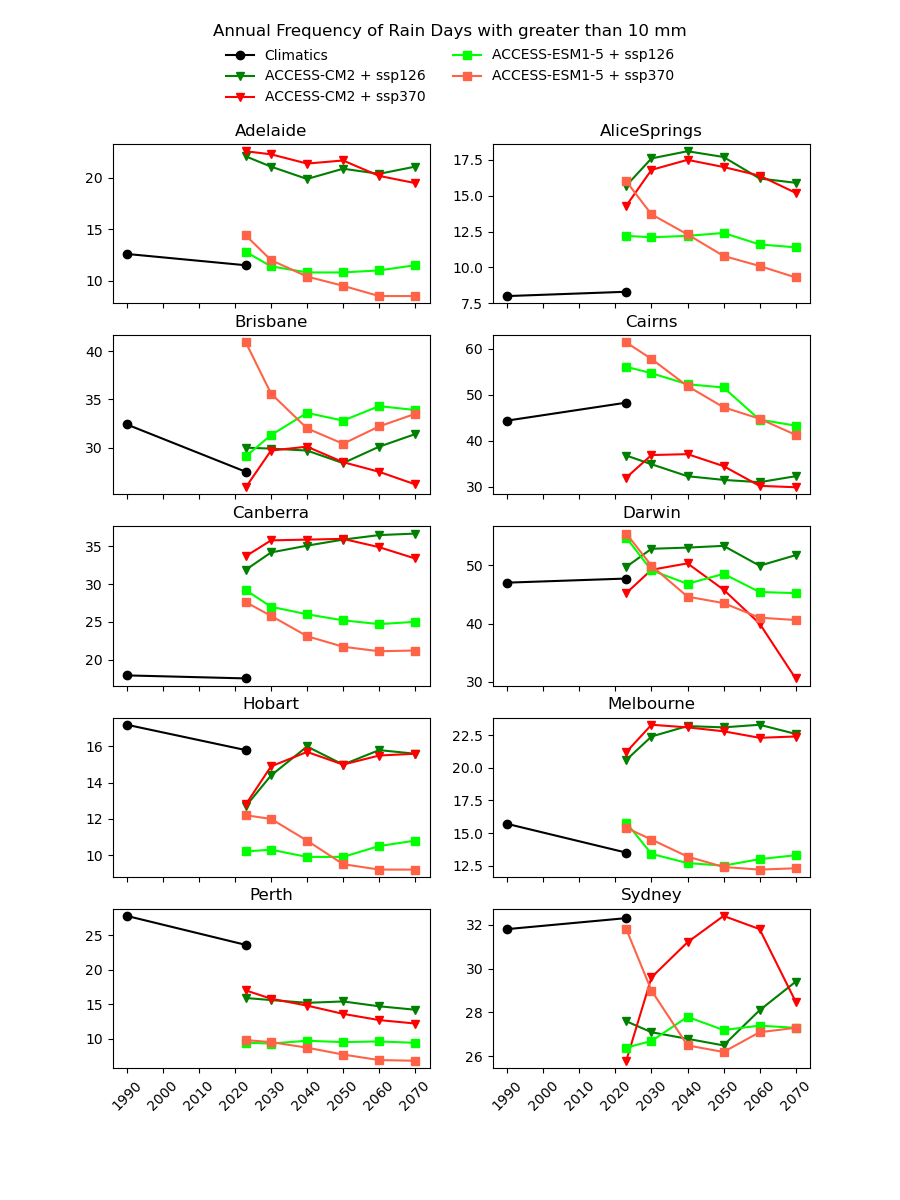
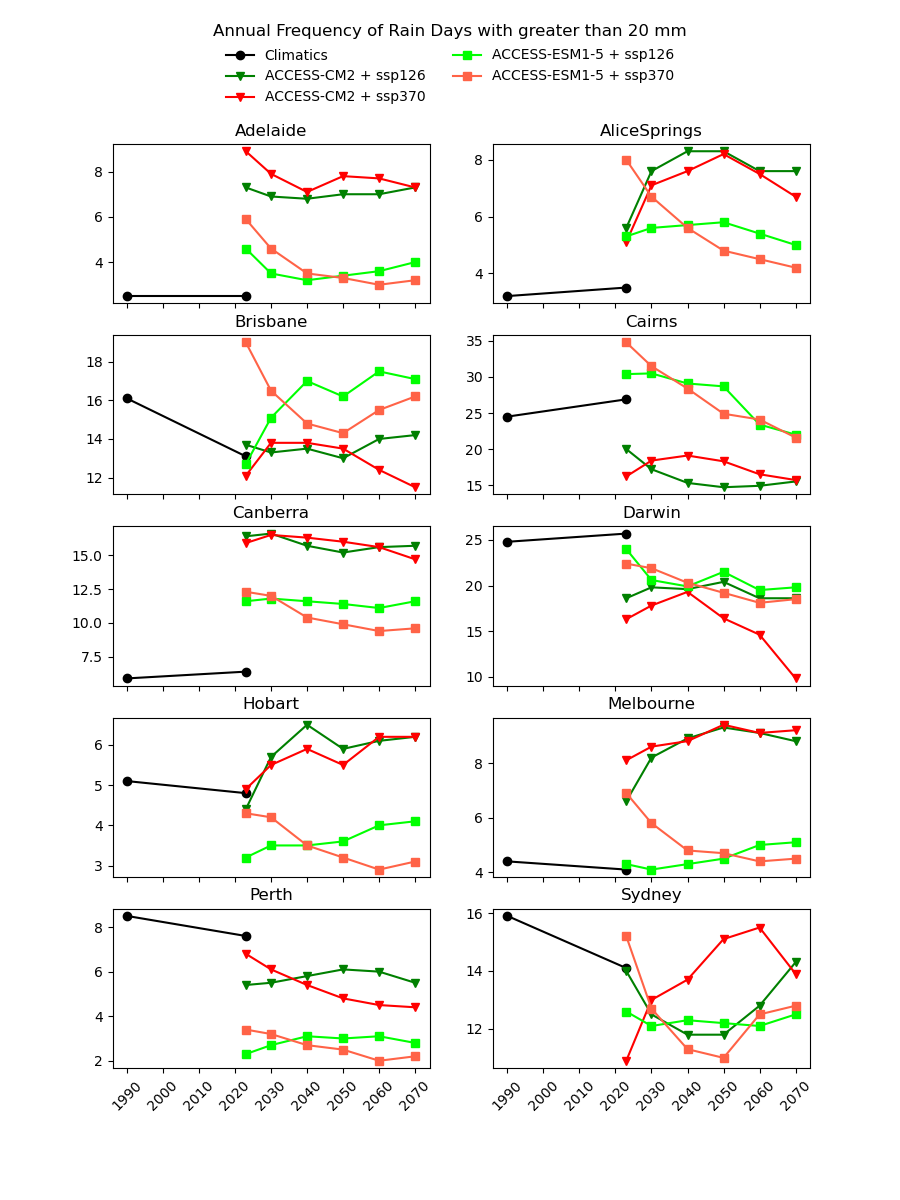
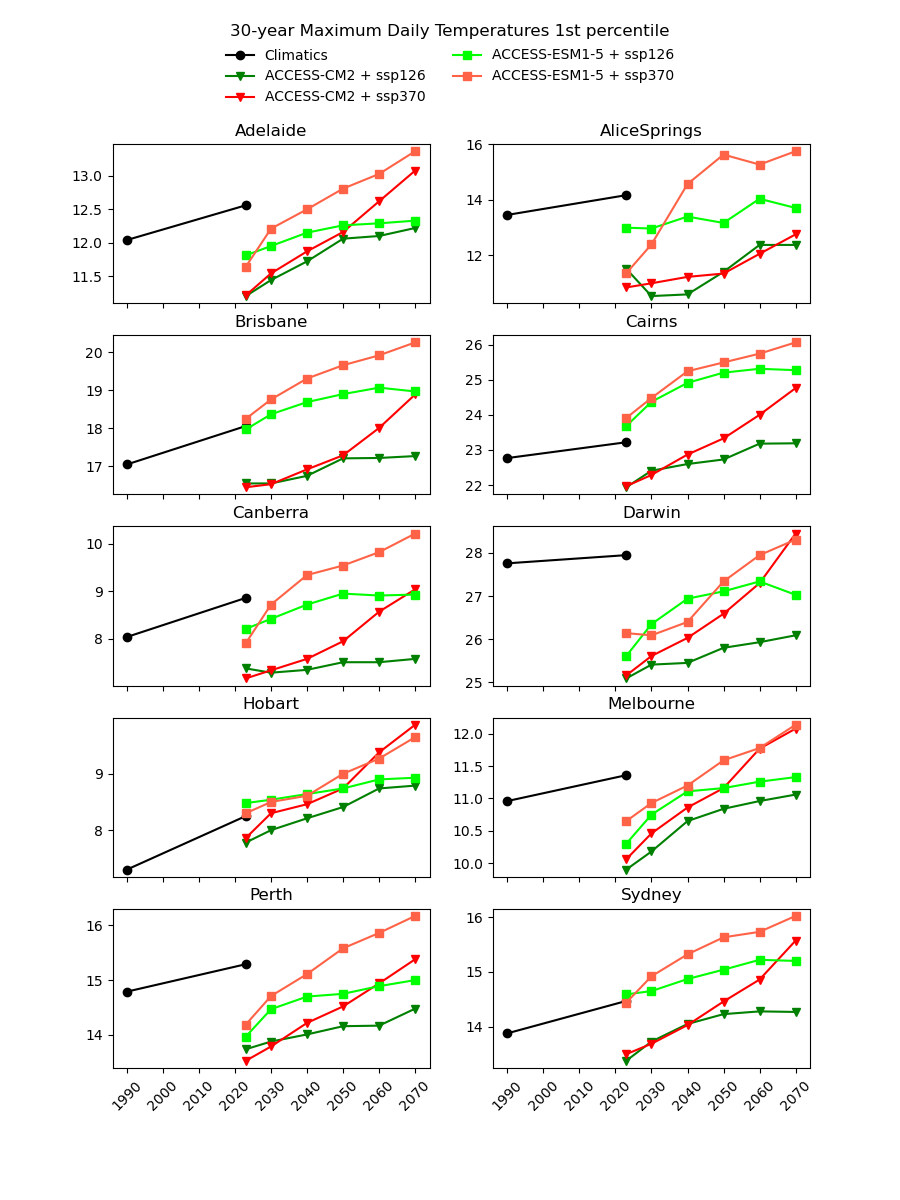
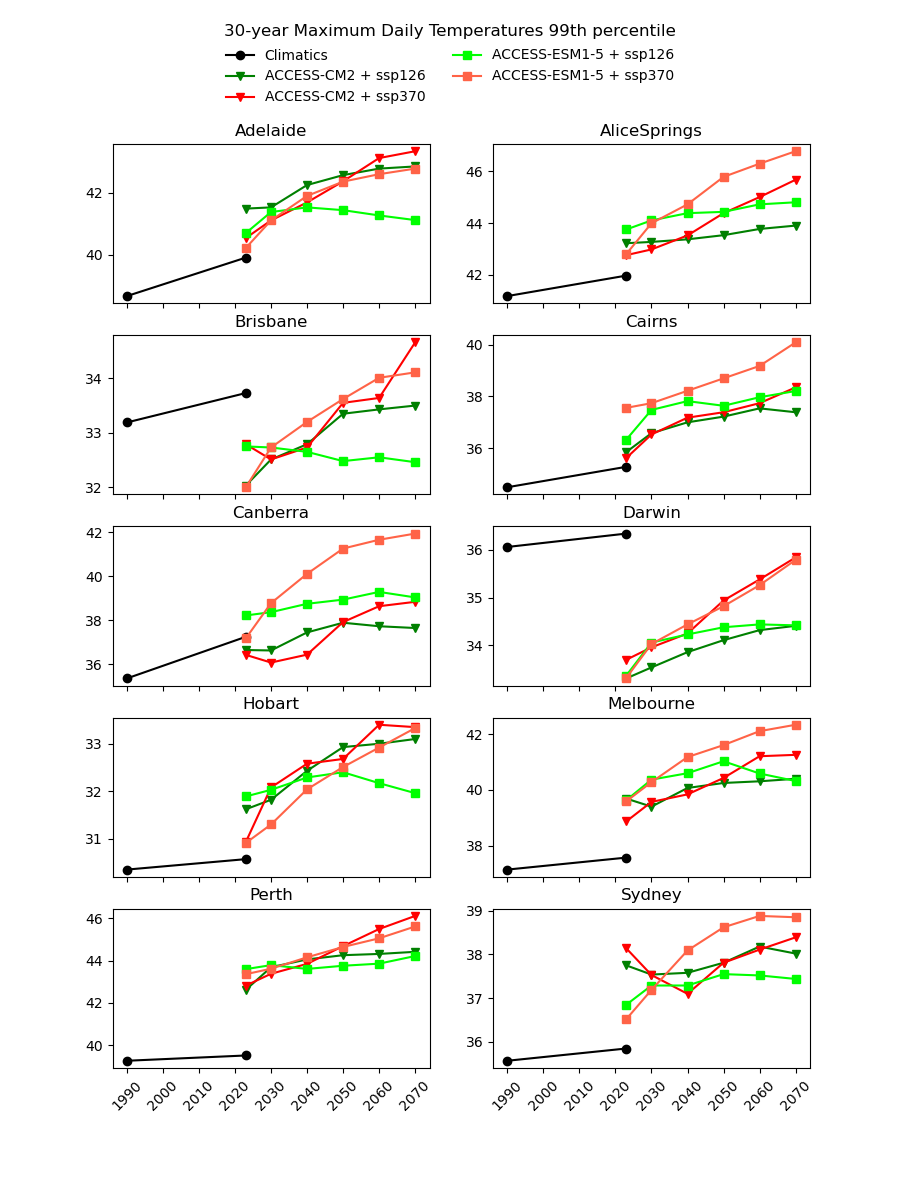
Notice the discontinuity where the AGCD data ends and the CMIP6 data begins. We see similar discrepancies for other metrics:
- CDD - Consecutive Dry (<1mm) Days
- CWD - Consecutive Wet (>1mm) Days
- RD_g0 - Rainfall Days >0mm
- RD_g1 - Rainfall Days >1mm
- RD_g5 - Rainfall Days >5mm
- RD_g10 - Rainfall Days >10mm
- RD_g20 - Rainfall Days >20mm
- RD_g50 - Rainfall Days >50mm
- RD_p95 - Rainfall Days 95th Percentile
- RD_p99 - Rainfall Days 99th Percentile
- TN_g20 - Days with Min Temp >20°C
- TN_g25 - Days with Min Temp >25°C
- TN_l0 - Days with Min Temp <0°C
- TN_l5 - Days with Min Temp <5°C
- TN_p01 - Daily Min Temp 1st Percentile
- TN_p99 - Daily Min Temp 99th Percentile
- TX_g35 - Days with Max Temp >35°C
- TX_g40 - Days with Max Temp >40°C
- TX_l0 - Days with Max Temp <0°C
- TX_l10 - Days with Max Temp <10°C
- TX_l15 - Days with Max Temp <15°C
- TX_p01 - Daily Max Temp 1st Percentile
- TX_p99 - Daily Max Temp 99th Percentile
Why not just "drag" the CMIP6 metrics up or down in value until they match the AGCD data at the transition point? The Darwin chart above illustrates how there would still be an obvious discontinuity in the trend of the data.
Why not just normalise the underlying CMIP6 variable so that its mean and standard deviation match the AGCD data? This would not help with the kinds of higher order, extremes-focused metrics we're trying to analyse (like heatwaves or consecutive wet days).
Why not use other basic kinds of scaling like Climate Change in Australia does? The key limitation of those approaches (used by My Cliamte View) is that they completely ignore any changes in dynamics that are being modelled. They do not produce a continuous time series, but instead append a scaled version of the historic observed time series, leaving a clear discontinuity. Furthermore, this actually wouldn't provide any information for metrics like heatwaves or consecutive wet days.
Why do this at all if it's not really what the CMIP6 data was intended for? Partially because of TCFD regulations, there is a growing demand for this kind of data and there are already some companies supplying some of it. We have found this data to be highly dubious, often with little to no explanation of how it was derived and no quantified uncertainties. We simply believe we can do better.
Problem Statement
In order to produce continuous graphs of weather metrics from 1950 to 2100, we need to develop a model to translate the low resolution, "blurry" CMIP6 data into something that statistically aligns with the high-resolution AGCD data.
Model Design
How do we go about solving this problem in a practical way? Do we fit a model for every AGCD pixel and every CMIP6 climate model? What kind of model should they be? Would some machine learning be useful? (In principle we should not have to fit different models for the different CMIP6 emissions scenarios since they all have the same starting point.) Some other more specific questions follow.
Do we translate CMIP6 variables and then derive metrics from those results, or do we translate metrics directly?
The advantage of the variable-based approach is that there would be a lot less model fitting to do, as there are at least 10 but ideally 30 or more metrics we would like to calculate for a given variable like daily maximum temperature. A variable-based model would also mean that metrics values would be guaranteed to be consistent with one another, i.e. the number of days over 40°C would always be less than the number of days over 35°C. However some metrics are very complex, and so metric-based models may be more likely to satisfy our research goal.
If doing a variable-based model, do we enforce that the mean of the downscaled data equals the original CMIP6 data?
![]()
In the image above, we could say we've derived 25 AGCD-aligned values for a variable (say temperature) based on a single CMIP6 value. The question is, should the mean of these 25 values equal that CMIP6 value? Traditional downscaling techniques would say "definitely yes", but enforcing this means a much more intensive model fitting procedure.
Should we consider the surrounding CMIP6 pixels?
![]()
The idea is that while a given point may be entirely within a single CMIP6 pixel, seeing the spatial distribution of data may improve the estimate, not unlike Kriging.
What other data should factor into the model?

The image above is a not-to-scale representation of some other useful data that we could incorporate into our models to improve the estimates. Elevation is known to have a particularly strong correlation with temperature so it is not hard to imagine how it could be useful. Land use is more subtle, but it may help to factor in urban-heat-island effects.
Should there be a random noise component?
Random noise may help to better replicate certain statistical behaviours that are fundamentally missing from the low resolution CMIP6 data. It may be particularly useful for precipitation.